
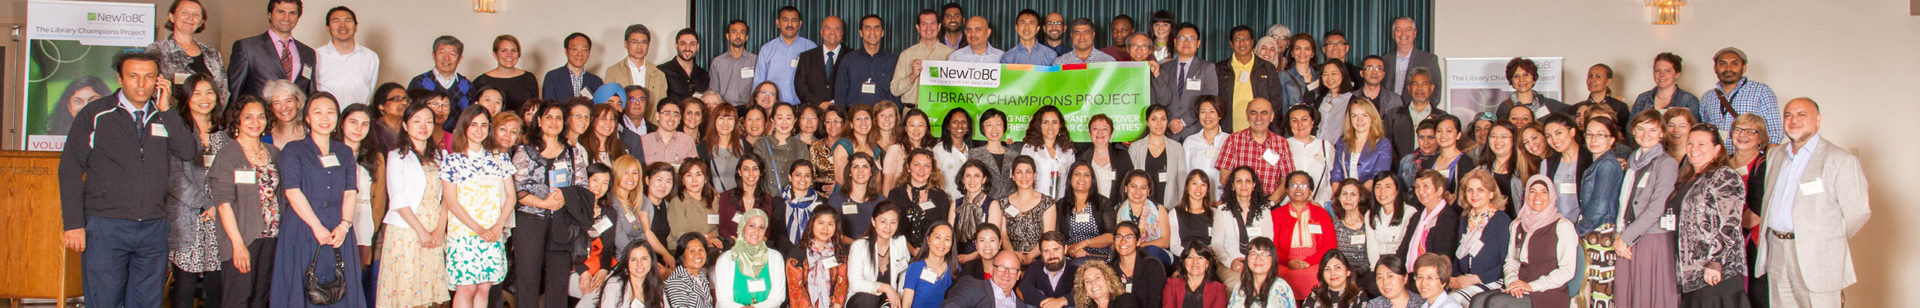
Since 2013, the Library Champions Project has been changing the lives of new immigrants in Metro Vancouver and the Fraser Valley. Thanks to our partners, including numerous libraries and community agencies, and to funding from Immigration, Refugees and Citizenship Canada (IRCC), we’ve grown every year, consistently exceeding our goals. Even when COVID-19 hit, we were able to adapt and move to deliver online and continued to exceed our targets.
By winter 2021, we had expanded our reach across British Columbia, delivering our services to newcomers, libraries, and service providers in more than 22 communities, including rural areas. Annually, over 200 individuals are trained as Library Champions; in total we’ve trained more than 2,300 new immigrants. Collectively, they’ve reached out to over 116,000 fellow newcomers through one-to-one meetings, group sessions, and emails, and have made over 2.45 million impressions via social media.
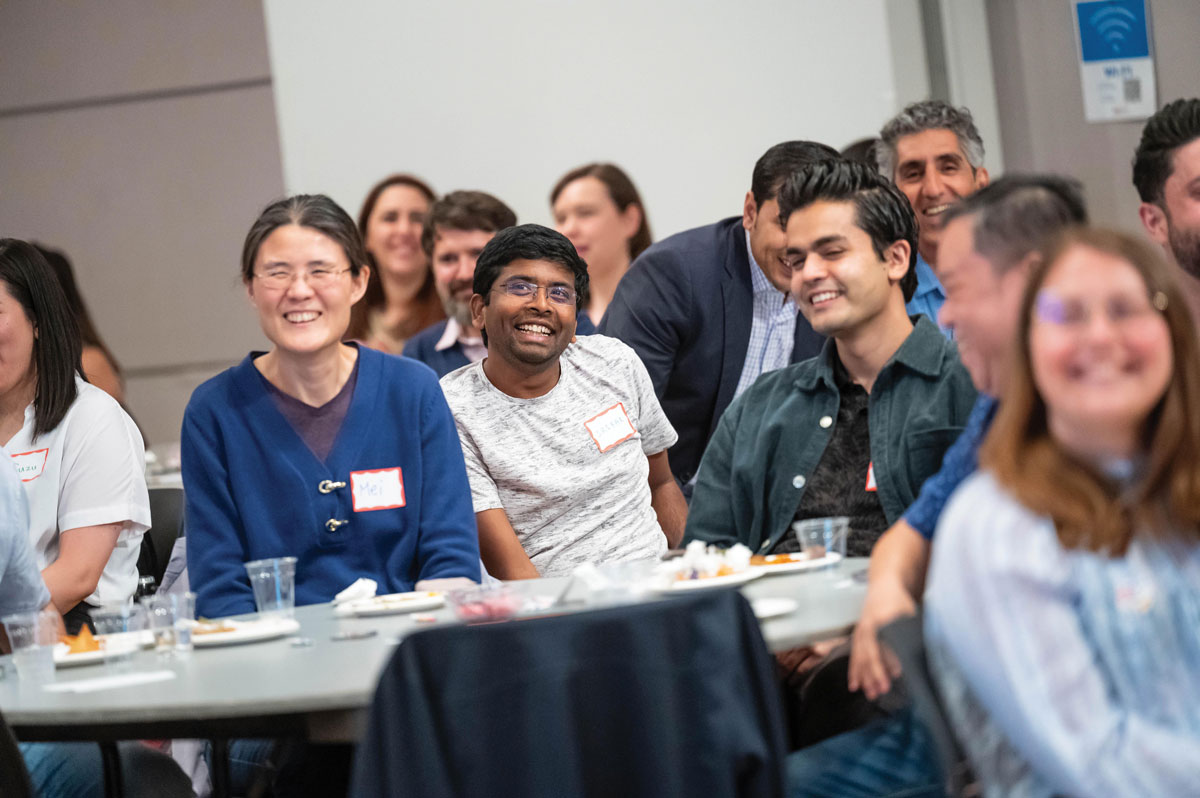
But our impact goes beyond numbers. Our Library Champions undergo transformative experiences, gaining skills, understanding different cultures, and forming lasting connections. They have become a vital component of the settlement continuum, guiding other newcomers to resources and services. Our program is more than just a service—it’s an essential part of the integration of thousands of newcomers to B.C.
To download a PDF version of these highlights, click here: Library Champions Project Highlights.
I am proud to be a member of this community and after participating in this project I feel even more connected to it and empowered to contribute to its further growth and success.

The Library Champions Project is an incredible adventure, allowing you to feel like a necessary and important part of a new country. Full of new friendships and valuable information.

Program Numbers per Year
Over the years, participation and program demand has remained high, but social media impressions have increased markedly.
| Community | Groups | Attendees of Info Session | LCs Enrolled | LCs Trained | LCs Completed Project | Newcommers Reached | Reps of Orgs Reached | Social Media Impressions |
|---|---|---|---|---|---|---|---|---|
| 2023-24 | 23 | 577 | 301 | 258 | 241 | 8,340 | 1,126 | 194,904 |
| 2022-23 | 20 | 377 | 247 | 208 | 198 | 6,051 | 982 | 989,816 |
| 2021-22 | 16 | 296 | 201 | 185 | 177 | 11,572 | 484 | 1,244,017 |
| 2020-21 | 16 | 263 | 195 | 184 | 175 | 6,079 | 406 | 14,135 |
| 2019-20 | 15 | 250 | 181 | 165 | 155 | 5,978 | 347 | 2,310 |
| 2018-19 | 15 | 197 | 184 | 175 | 170 | 8,303 | 510 | 3,617 |
| 2017-18 | 15 | 179 | 176 | 168 | 166 | 8,232 | 699 | 1,532 |
| 2016-17 | 15 | 230 | 195 | 189 | 178 | 9,683 | 684 | 7,993 |
| 2015-16 | 16 | 307 | 237 | 219 | 203 | 13,675 | 970 | 0 |
| 2014-15 | 15 | 334 | 207 | 204 | 193 | 13,062 | 843 | 0 |
| 2013-14 | 30 | 664 | 363 | 357 | 345 | 25,513 | 2,114 | 0 |
| Grand Total | 196 | 3,674 | 2,487 | 2,312 | 2,201 | 116,488 | 9,255 | 2,458,324 |
Numbers by Community Since Inception
Program participation continues to expand, reaching newcomers across the province.
| Community | Groups | Attendees of Info Session | LCs Enrolled | LCs Trained | LCs Completed Project | Newcommers Reached | Reps of Orgs Reached | Social Media Impressions |
|---|---|---|---|---|---|---|---|---|
| Vancouver | 40 | 896 | 532 | 494 | 468 | 29,803 | 2,243 | 1,487,257 |
| Surrey | 31 | 672 | 465 | 434 | 417 | 20,868 | 2,285 | 143,965 |
| Burnaby & New Westminster | 25 | 404 | 311 | 281 | 274 | 12,361 | 821 | 133,428 |
| Coquitlam & Port Moody | 24 | 466 | 318 | 299 | 289 | 15,949 | 960 | 101,763 |
| Richmond | 23 | 382 | 277 | 264 | 245 | 13,358 | 986 | 306,461 |
| North Shore | 22 | 332 | 256 | 243 | 225 | 13,709 | 775 | 102,360 |
| Langley | 8 | 145 | 111 | 106 | 98 | 3,777 | 307 | 147,626 |
| Regional Groups | 7 | 179 | 76 | 62 | 61 | 1,739 | 556 | 22,695 |
| Maple Ridge & Port Coquitlam | 6 | 80 | 59 | 55 | 52 | 1,843 | 86 | 2,043 |
| Abbotsford & Mission | 5 | 61 | 52 | 46 | 44 | 1,887 | 143 | 1,491 |
| Greater Victoria | 3 | 25 | 18 | 16 | 16 | 477 | 42 | 5,440 |
| Central Okanagan (Kelowna) | 1 | 17 | 6 | 6 | 6 | 200 | 11 | 3,795 |
| Delta | 1 | 15 | 6 | 6 | 6 | 517 | 41 | 0 |
| Grand Total | 196 | 3,674 | 2,487 | 2,312 | 2,201 | 116,488 | 9,255 | 2,458,324 |
2023 – 2024 Program Highlights
In 2023 – 2024, NewToBC offered 23 cycles of the program, recruiting 301 Library Champions (258 completed training, 241 completed the program). Champions originated from more than 87 countries, reflective of the diverse demographics of new immigrants to British Columbia.
These Champions reached out to 8,340 other newcomers and delivered 1,216 presentations to groups at a range of community agencies. They made more than hundreds of posts on various social media platforms, including ethnic social media platforms, promoting the project and library and community resources. These posts made nearly 200,000 impressions across platforms.
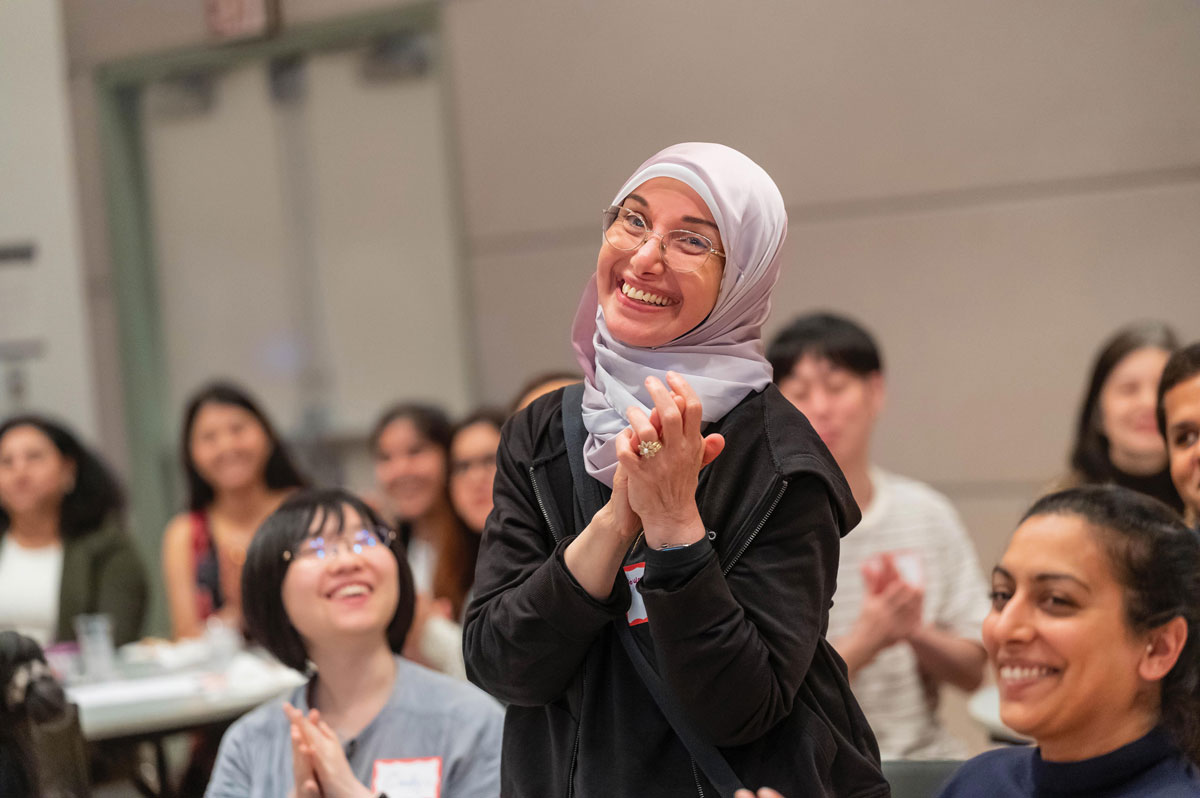
By getting involved, you open doors to not only discovering more about the library but also enhancing essential skills like communication, listening, and presentation.
I’d definitely recommend the program, and I’d do it by saying that it is the most efficient way to connect with other newcomers, learn about the different library services, practice your English in a safe group, and find yourself belonging to the community.
| Community | Groups | Attendees of Info Session | LCs Enrolled | LCs Trained | LCs Completed Project | Newcommers Reached | Reps of Orgs Reached | Social Media Impressions |
|---|---|---|---|---|---|---|---|---|
| Abbotsford & Mission | 1 | 17 | 9 | 5 | 5 | 149 | 28 | 135 |
| Burnaby & New Westminster | 2 | 64 | 32 | 28 | 28 | 965 | 49 | 77,326 |
| Coquitlam & Port Moody | 2 | 44 | 23 | 21 | 20 | 588 | 72 | 29,782 |
| Greater Victoria | 1 | 8 | 5 | 5 | 5 | 115 | 33 | 133 |
| Langley | 1 | 25 | 14 | 14 | 12 | 368 | 7 | 194 |
| Maple Ridge & Port Coquitlam | 2 | 35 | 21 | 20 | 19 | 886 | 29 | 589 |
| North Shore | 1 | 11 | 8 | 5 | 3 | 215 | 9 | 1.181 |
| Regional Groups | 5 | 129 | 48 | 36 | 36 | 982 | 462 | 18,400 |
| Richmond | 2 | 49 | 27 | 27 | 21 | 806 | 44 | 35,963 |
| Surrey | 3 | 64 | 61 | 54 | 53 | 1,174 | 299 | 7,548 |
| Vancouver | 3 | 131 | 53 | 43 | 39 | 2,092 | 184 | 23,653 |
| Grand Total | 23 | 577 | 301 | 258 | 241 | 8,340 | 1,216 | 194,904 |